Legacy recipe: Psyplot Diagnostics#
Note
This recipe has been retired and moved to the folder “archive”. This recipe is only included for documentation purposes and not maintained any more. The last known ESMValTool version supporting this recipe is version 2.12.0.
Overview#
These recipes showcase the use of the Psyplot diagnostic that provides a high-level interface to Psyplot for ESMValTool recipes.
Available recipes and diagnostics#
Recipes are stored in recipes/
recipe_psyplot.yml
Diagnostics are stored in archive/legacy_diag_scripts
psyplot_diag.py
Variables#
Arbitrary variables are supported.
Observations and reformat scripts#
Arbitrary datasets are supported.
References#
Sommer, (2017), The psyplot interactive visualization framework, Journal of Open Source Software, 2(16), 363, doi:10.21105/joss.00363
Example plots#
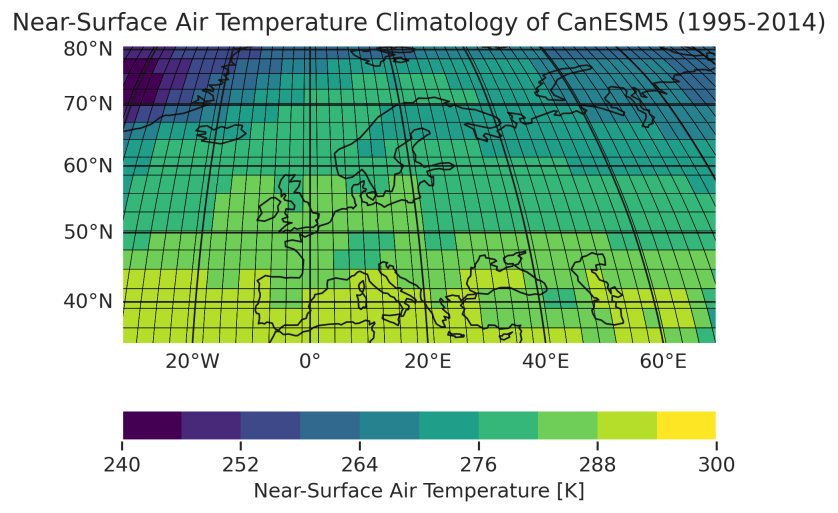
Fig. 282 Historical near-surface air temperature climatology over Europe simulated by CanESM5 between 1995 and 2014. The plot visualizes the invidividual rectangular grid cells of the model’s regular grid.#
Fig. 283 Historical near-surface air temperature climatology over Europe simulated by ICON-ESM-LR between 1995 and 2014. The plot visualizes the invidividual triangular grid cells of the model’s unstructured grid.#