Generating Climate Patterns from CMIP6 Models#
Overview#
The recipe recipe_climate_patterns generates climate patterns from CMIP6 model datasets.
Note
The regrid setting in the recipe is set to a 2.5x3.75 grid. This is done to match the current resolution in the IMOGEN-JULES model, but can be adjusted with no issues for a finer/coarser patterns grid.
Available recipes and diagnostics#
Recipes are stored in esmvaltool/recipes/
recipe_climate_patterns.yml
Diagnostics are stored in esmvaltool/diag_scripts/climate_patterns/
climate_patterns.py: generates climate patterns from input datasets
sub_functions.py: set of sub functions to assist with driving scripts
plotting.py: contains all plotting functions for driving scripts
User settings in recipe#
Script climate_patterns.py
Required settings for script
None
Optional settings for script
jules_mode: output jules-specific var names + .nc files
parallelise: parallelise over models or not
area: calculate the patterns globally, or over land only
Required settings for variables
short_name
additional_datasets
Optional settings for variables
None
Required settings for preprocessor
monthly_statistics: converts data to mean monthly data
Optional settings for preprocessor
regrid: regrids data
Variables#
Script climate_patterns.py
tasmax (atmos, monthly, longitude latitude time)
tasmin (atmos, monthly, longitude latitude time)
tas (atmos, monthly, longitude latitude time)
huss (atmos, monthly, longitude latitude time)
pr (atmos, monthly, longitude latitude time)
sfcWind (atmos, monthly, longitude latitude time)
ps (atmos, monthly, longitude latitude time)
rsds (atmos, monthly, longitude latitude time)
rlds (atmos, monthly, longitude latitude time)
Observations and reformat scripts#
None
References#
Huntingford, C., Cox, P. An analogue model to derive additional climate change scenarios from existing GCM simulations. Climate Dynamics 16, 575–586 (2000). https://doi.org/10.1007/s003820000067
Mathison, C. T. et al. A rapid application emissions-to-impacts tool for scenario assessment: Probabilistic Regional Impacts from Model patterns and Emissions (PRIME). EGUsphere [preprint], (2024). https://doi.org/10.5194/egusphere-2023-2932
Example plots#
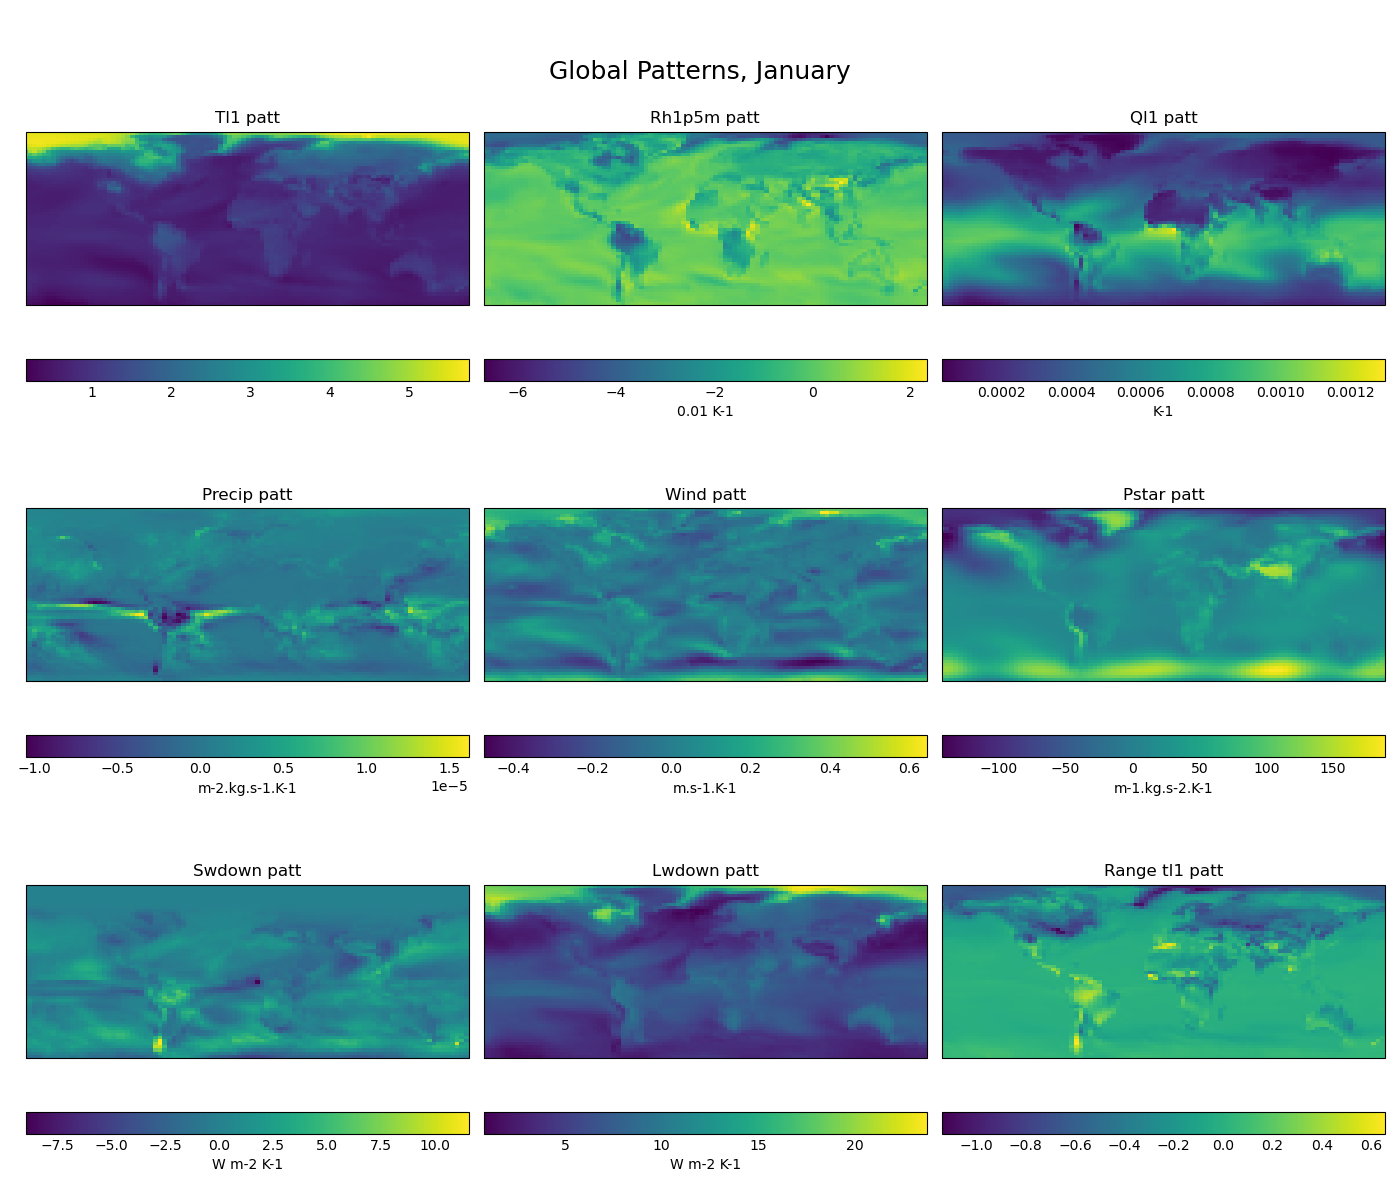
Fig. 40 Patterns generated for CMIP6 models, gridded view. Patterns are shown per variable, for the month of January.#