Legacy recipe: Constraining uncertainty in projected gross primary production (GPP) with machine learning#
Note
This recipe has been retired and moved to the folder “archive”. This recipe is only included for documentation purposes and not maintained any more. The last known ESMValTool version supporting this recipe is version 2.12.0.
Warning
Not all datasets necessary to run these recipes are available on ESGF. The following datasets are missing:
Dataset: co2, Amon, CMIP5, HadGEM2-ES, esmHistorical, r1i1p1
Dataset: gpp, Lmon, CMIP5, MIROC-ESM, esmFixClim1, r1i1p1
Supplementary: sftlf, fx, CMIP5, MIROC-ESM, esmFixClim1, r0i0p0
Overview#
These recipes reproduce the analysis of Schlund et al., JGR: Biogeosciences (2020). In this paper, a machine learning regression (MLR) approach (using the MLR algorithm Gradient Boosted Regression Trees, GBRT) is proposed to constrain uncertainties in projected gross primary production (GPP) in the RCP 8.5 scenario using observations of process-based diagnostics.
Recipes and diagnostics#
Recipes are stored in archive/legacy_recipes/
schlund20jgr/recipe_schlund20jgr_gpp_abs_rcp85.yml
schlund20jgr/recipe_schlund20jgr_gpp_change_1pct.yml
schlund20jgr/recipe_schlund20jgr_gpp_change_rcp85.yml
Diagnostics are stored in archive/legacy_diag_scripts/
mlr/evaluate_residuals.py
mlr/main.py
mlr/mmm.py
mlr/plot.py
mlr/postprocess.py
mlr/preprocess.py
mlr/rescale_with_emergent_constraint.py
Variables#
co2s (atmos, monthly, longitude, latitude, time)
gpp (land, monthly, longitude, latitude, time)
gppStderr (land, monthly, longitude, latitude, time)
lai (land, monthly, longitude, latitude, time)
pr (atmos, monthly, longitude, latitude, time)
rsds (atmos, monthly, longitude, latitude, time)
tas (atmos, monthly, longitude, latitude, time)
Observations and reformat scripts#
CRU (pr, tas)
ERA-Interim (rsds)
LAI3g (lai)
MTE (gpp, gppStderr)
Scripps-CO2-KUM (co2s)
References#
Schlund, M., Eyring, V., Camps‐Valls, G., Friedlingstein, P., Gentine, P., & Reichstein, M. (2020). Constraining uncertainty in projected gross primary production with machine learning. Journal of Geophysical Research: Biogeosciences, 125, e2019JG005619, https://doi.org/10.1029/2019JG005619.
Example plots#
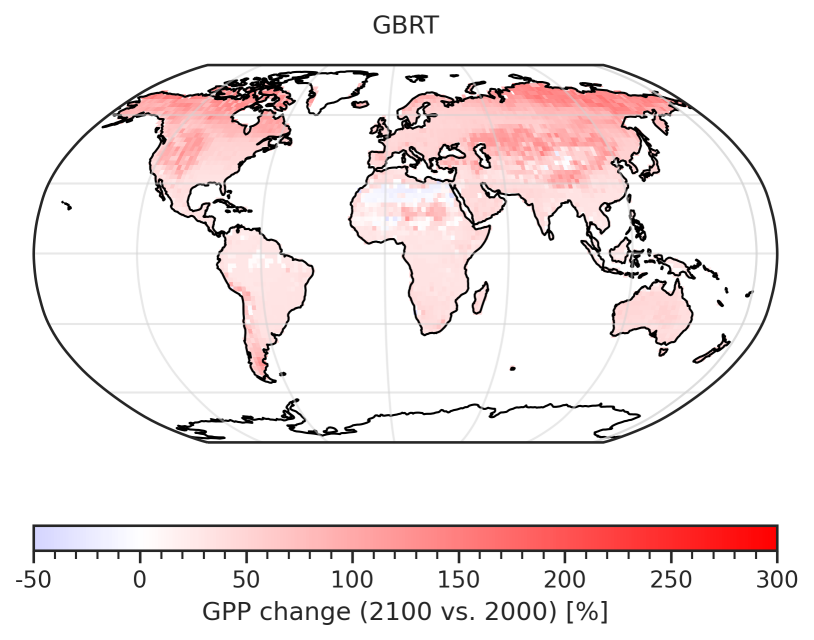
Fig. 285 GBRT-based prediction of the fractional GPP change over the 21st century (= GPP(2091-2100) / GPP(1991-2000)).#
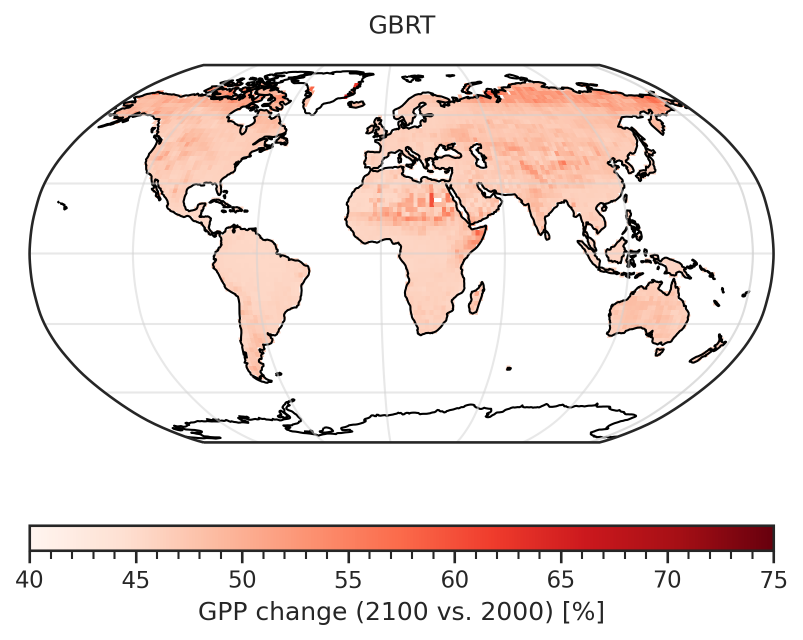
Fig. 286 Corresponding error of the GBRT-based prediction of the fractional GPP change over the 21st century (considering errors in the MLR model and errors in the predictors).#
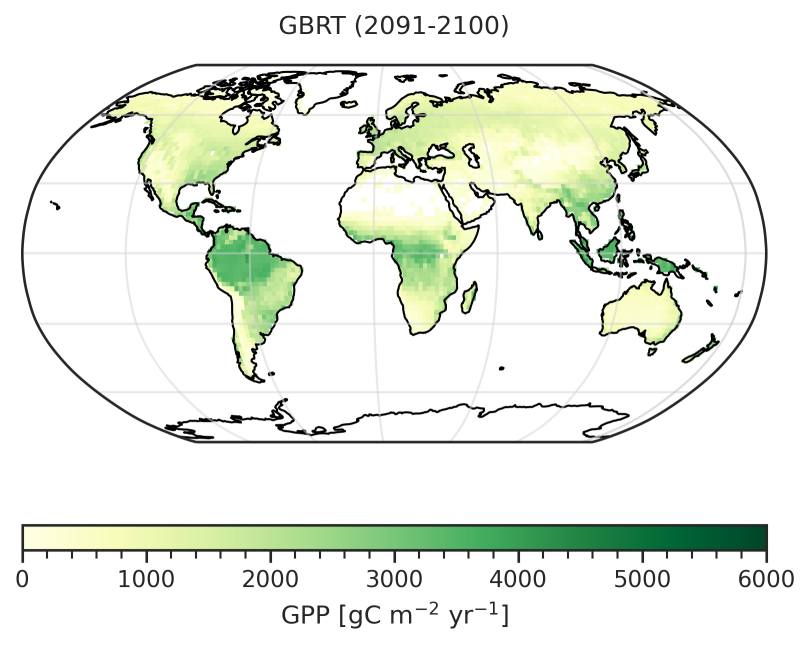
Fig. 287 GBRT-based prediction of the absolute GPP at the end of the 21st century (2091-2100).#
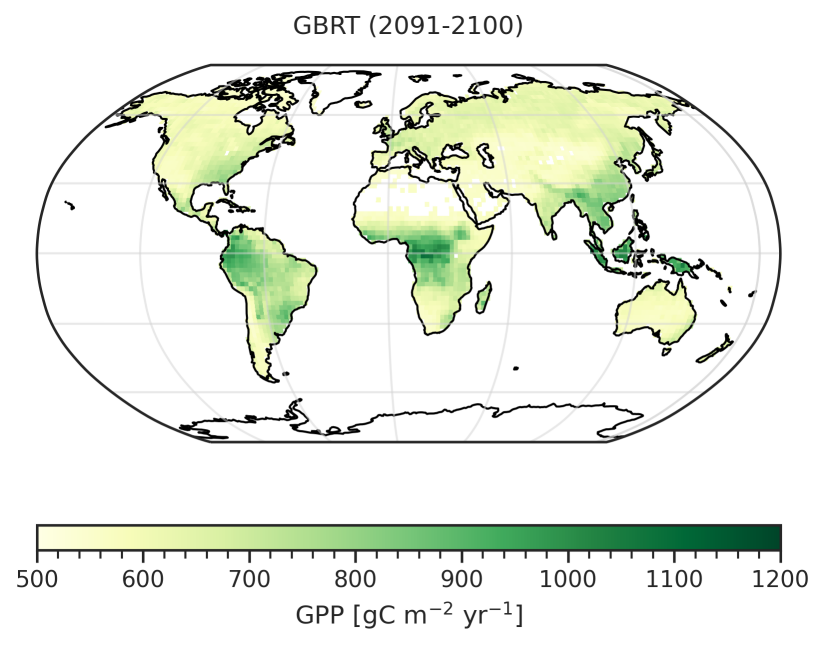
Fig. 288 Corresponding error of the GBRT-based prediction of the absolute GPP at the end of the 21st century (considering errors in the MLR model and errors in the predictors).#
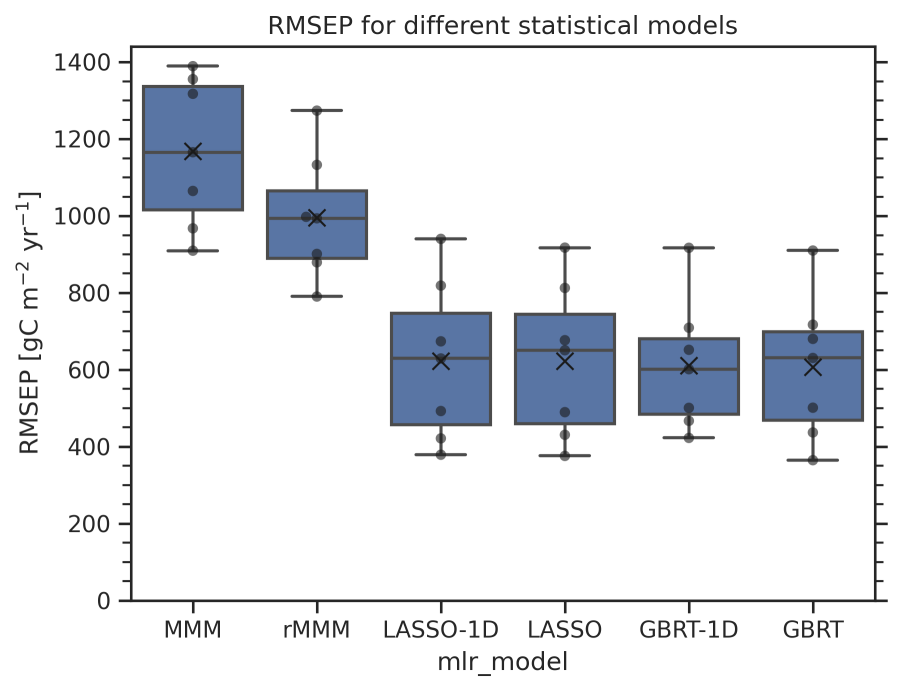
Fig. 289 Boxplot of the root mean square error of prediction (RMSEP) distributions for six different statistical models used to predict future absolute GPP (2091-2100) using a leave-one-model-out cross-validation approach. The distribution for each statistical model contains seven points (black dots, one for each climate model used as truth) and is represented in the following way: the lower and upper limit of the blue boxes correspond to the 25% and 75% quantiles, respectively. The central line in the box shows the median, the black “x” the mean of the distribution. The whiskers outside the box represent the range of the distribution#
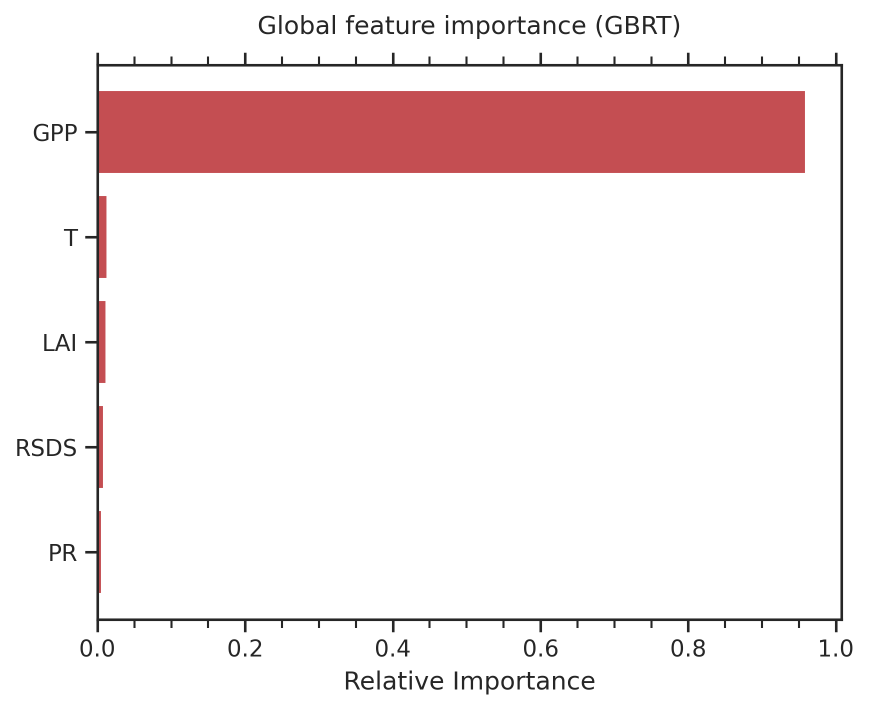
Fig. 290 Global feature importance of the GBRT model for prediction of the absolute GPP at the end of the 21st century (2091-2100).#
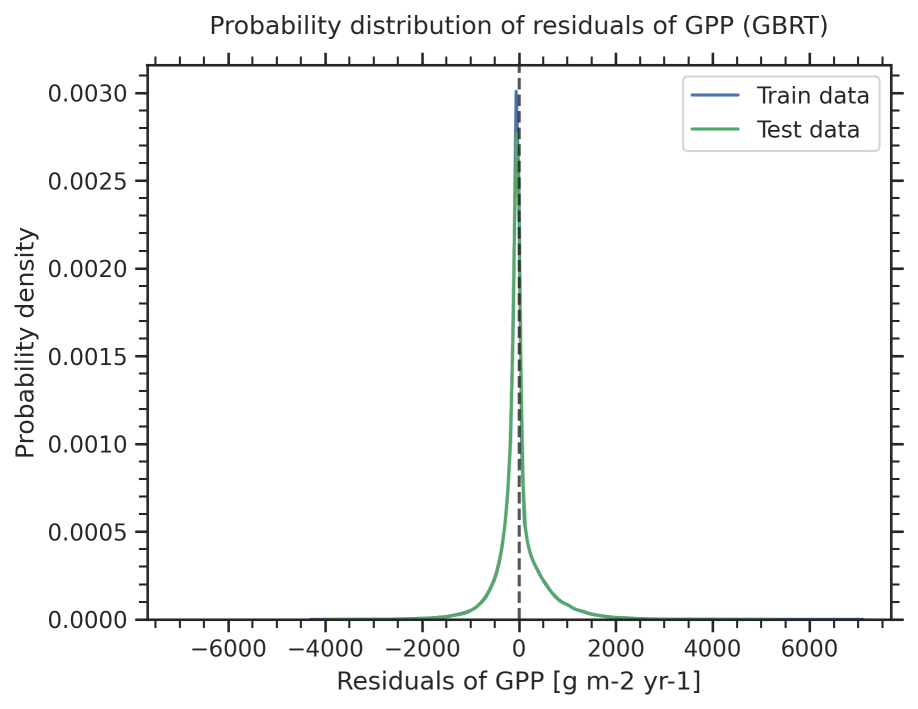
Fig. 291 Distribution of the residuals of the GBRT model for the prediction of absolute GPP at the end of the 21st century (2091-2100) for the training data (blue) and test data excluded from training (green).#
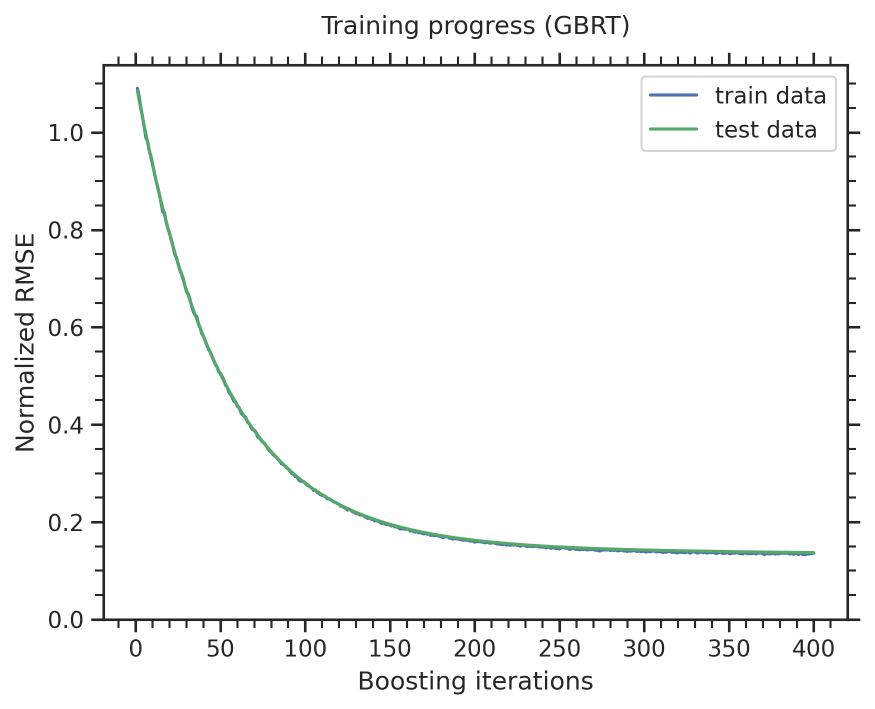
Fig. 292 Training progress of the GBRT model for the prediction of absolute GPP at the end of the 21st century (2091-2100) evaluated as normalized root mean square error on the training data (blue) and test data excluded from training (green).#